
Page 23 - PCC06
P. 23
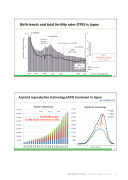
 Birth trends and total fertility rates (TFR) in Japan
300
出 200
生
(昭和22~24年)
5
4
2.7million
第2次ベビーブーム
(昭和46~49年)
最高の出生数
2 696 638人
2.1 million
昭和41年
Hinoeuma:
ひのえうま
平成26年 最低の出生数
Japanese
1 360 974人
Equal Employment Act of 1986
1.0 million
合 計
superstition
1 003 532人
3特
2 091 983人
2016
0.98 million babies TFR = 1.44
出N生u m数b e r o f b i r t h s 合T計FR特殊出生率
Source: Vital Statistics
Assisted reproductive technology (ART) treatment in Japan
450,000 400,000 350,000 300,000 250,000 200,000 150,000 100,000
2010
2012
2015
50,000
数2生 100 率
1
00 22 ・ 30 ・ 40 ・ 50 ・ 60 2 7 ・ 17 ・ 26
1947 1955 1965 1975 1985 2005 2014
4
Number of ART cycles
FET周期 ICICSSI周I期 IVF周期 Of 424,000 cycles,
51,000 babies were born in 2015
45,000 40,000 35,000 30,000 25,000 20,000 15,000 10,000
Number of cycles by age
5,000 00
Page 17 of 90
平成17年2005 最低の合計特殊出生率 1.26
殊 出
TFR = 1.26
20平1成426年 1 . 4 2
TFR= 1.42
≤2022 24 26 28 30 32 34 36 38 40 42 44 46 4850+
1992
1993 123 1994
1995
1996
1997
1998
1999
2000
2001
2002
2003
2004
2005
2006
2007
2008
2009
2010
2011
2012
2013
2014
2015
Number of Births (million)
Total Fertility Rate
PRECONGRESS COURSE 06 I BARCELONA, SPAIN – 1 JULY 2018
23
Age of women
5
