
Page 80 - PCC07
P. 80
Toward harmonization of Ultrasound?
11
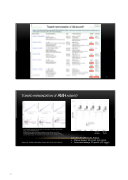
TOWARD HARMONIZATION OF AMHASSAYS?
(A) Correlation between Gen II ELISA, AL-105i ELISA, or Access Dxi automatic assay and EIA AMH/MIS ELISA
(B) Bland-Altman plots showing the distribution of the differences of AMH concentration between two methods (y-axis) according to the average of AMH concentration (x-axis). The red horizontal line shows the mean difference (or bias).
Pigny et al, Fertility and Sterility, Volume 105, 2016, 1063–1069.e3
Access Beckman
Cut-off for PCOM in Lille, France:
Elecsys Roche
Page 73 of 196
Manual assays: 40 pmol/L (5.6 ng/ml),
Automated assays: 30 pmol/L (4.2 ng/ml) 12
80
