
Page 73 - Eshre 2018
P. 73
60.00% 50.00% 40.00% 30.00% 20.00% 10.00%
0.00%
Year
2007 2008 2009 2010 2011 2012 2013 2014 2015 2016 2017 Total
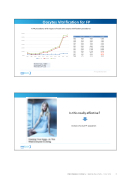
Onco. FP
1,80% 1,20% 1,20% 2,40% 2,40% 2,50% 3,00% 2,90% 2,80%
Social FP
4,90% 2,30% 2,60% 3,20% 7,20% 8,00% 12,50% 17,90% 21,50%
Total FP
6,70% 3,50% 3,90% 5,60% 9,60% 10,50% 15,60% 20,80% 24,30% 53,2% 55,7% 24,8%
IVI unpublished data
Oocytes Vitrification for FP
% FP procedures with respect of total own oocytes vitrification procedures
2007
2008
2009
2010 Onco. FP
2011
2012 Social FP
2013
2014 Total FP
2015
2016
2017
4,8% 48,4% 4,3% 51,4% 3,7% 21,1%
No Total Vit proc. = 30606
NoTotal Social FP= 6465
NoTotal Onco FP= 1139
Page 67 of 135
Is this really effective?
Analysis of actual FP population
PRECONGRESS COURSE 16 I BARCELONA, SPAIN – 1 JULY 2018 73
