
Page 101 - ESHRE2019
P. 101
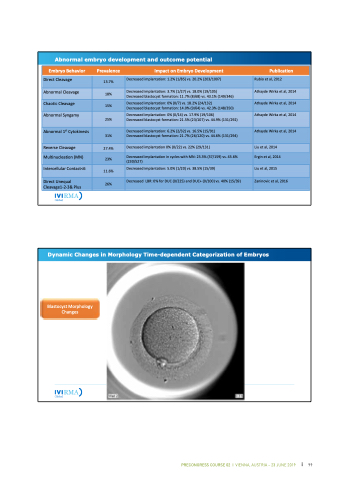
  Abnormal embryo development and outcome potential
     Embryo Behavior Prevalence Impact on Embryo Development Publication
Incidence of Abnormal Patterns
          Impact on Clinical Outcome
                                                Direct Cleavage
35,0%
Decreased implantation: 1.2% (1/85) vs. 20.2% (203/1007)
Rubio et al, 2012
   Abnormal Cleavage
13.7%
50% 301,80%
Decreased implantation: 3.7% (1/27) vs. 18.0% (19/105)
     Chaotic Cleavage
      Abnormal Syngamy
45%
15%
25,0% 40%
202,3505%
30%
Decreased implantation: 6.2% (2/32) vs. 16.5% (15/91)
Decreased blastocyst formation: 11.7% (8/68) vs. 432.71,4%(149/346)
Decreased implantation:250,%0%(0/7) vs. 18.2% (24/132)
43%
31,0%
IR Normal IR Abnormal
Athayde Wirka et al, 2014
40%
  26,0%
Athayde Wirka et al, 2014
 Decreased blastocyst formation: 14.0% (9/64) vs. 42.3% (148/3502)3,0%
Decreased implantation: 0% (0/14) vs. 17.9% (19/106)
Decreased blastocyst formation: 21.5% (23/107) vs. 44.9% (131/292)
18,0%
Athayde Wirka et al, 2014
     Abnormal 1st Cytokinesis
     Reverse Cleavage
      Multinucleation (MN)
 Intercellular Contact<6
         Direct Unequal Cleavage1‐2‐3& Plus
15,0%
13,7%
  31%
Decreased blastocyst formation: 21.7% (26/120) vs. 44.6% (131/294)
22%
25%
10,0% 20% 27.4%
15% 5,0% 23%
11.6%
0%
26%
ubio Athayde Athayde Athayde Liu Ergin
20%
Decreased18im% plantation180% (0/22) vs. 22% (29/131) 17%
(230/527)
Decreased implantation: 5.0% (1/20) vs. 38.5% (15/39)
Decreased LBR: 0% for DUC (0/225) and DUC+ (0/100) vs. 40% (15/39)
Athayde Wirka et al, 2014
Liu et al, 2014
  10% 0,0%
Liu et al, 2015
  5%
Decreased implantation in cycles with MN: 23.3% (37/159) vs. 43.6%
Ergin et al, 2014
Zaninovic et al, 2016
Zaninovic
 R
               Dynamic Changes in Morphology Time-dependent Categorization of Embryos
Blastocyst Morphology Changes
               96
 PRECONGRESS COURSE 02 I VIENNA, AUSTRIA – 23 JUNE 2019 99
