
Page 63 - ESHRE2019
P. 63
Diagnostic accuracy of MRI for adenomyosis
Study Design / Sensitivity Specificity PPV NPV AUC Patients
Stamatopoulos et al
/ 2012
Moghadam et al
/ 2006
Dueholm et al
/ 2001
Bazot et al
/ 2001
Reinhold et al
/ 1996
Ascher et al
/ 1994
Prospective (N=135)
Retrospective (N=153)
Prospective (N=106)
Prospective 8 cm (N=120)
Prospective (N=119)
Prospective (N=20)
46.15 38.71 63.64 77.50 85.71 88.24
99.08 90.98 88.10 92.50 85.71 66.67
92.31 52.17 58.33 83.78 64.86 93.75
88.52 85.38 90.24 89.16 95.12 50.00
0.726 (0.643 – 0.799)
0.648 (0.567 – 0.724)
0.759 (0.666 – 0.836)
0.850 (0.773 – 0.909)
0.857 (0.781 – 0.914)
0.775 (0.535 – 0.927)
High Overall Diagnostic performance of MRI: Area Under the Curve (AUC) >0.75 High specificity (& high PPV): the possibility of adenomyosis found in MRI to be
correctly diagnosed is very high (>90%)
Stamatopoulos et al, JMIG, 19:620‐626 , 2012
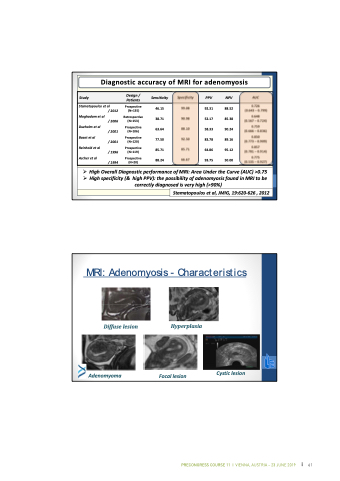
MRI: Adenomyosis - Characteristics
Diffuse lesion
Hyperplasia
Adenomyoma Focal lesion
Cystic lesion
58
PRECONGRESS COURSE 11 I VIENNA, AUSTRIA – 23 JUNE 2019 61
