
Page 19 - ESHRE2019
P. 19
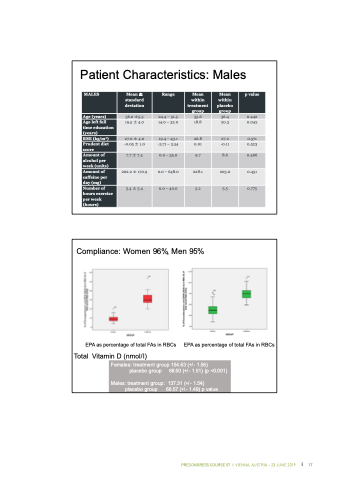
 Patient Characteristics: Males
        MALES
Mean ± standard deviation
  Range
Mean within treatment group
Mean within placebo group
p value
Age (years)
36.0 ±5.5
24.4 – 51.5
35.6
36.4
0.442
Age left full time education (years)
19.5 ± 4.0
14.0 – 32.0
18.8
20.3
0.042
BMI (kg/m2)
27.0 ± 4.0
19.4 – 43.1
26.8
27.2
0.571
Prudent diet score
-0.05 ± 1.0
-3.71 – 3.54
0.01
-0.11
0.523
Amount of alcohol per week (units)
7.7 ± 7.4
0.0 – 35.0
9.7
8.6
0.466
Amount of caffeine per day (mg)
202.2 ± 170.9
0.0 – 648.0
228.1
203.0
0.451
Number of hours exercise per week (hours)
5.4 ± 5.4
0.0 – 40.0
5.2
5.5
0.775
                  Compliance: Women 96%, Men 95%
EPA as percentage of total FAs in RBCs EPA as percentage of total FAs in RBCs Total Vitamin D (nmol/l)
   Females: treatment group 154.63 (+/- 1.56)
placebo group 68.50 (+/- 1.51) (p <0.001)
Males: treatment group: 137.31 (+/- 1.54) placebo group 66.57 (+\- 1.49) p value
 14
 PRECONGRESS COURSE 07 I VIENNA, AUSTRIA – 23 JUNE 2019 17
