
Page 66 - ESHRE2019
P. 66
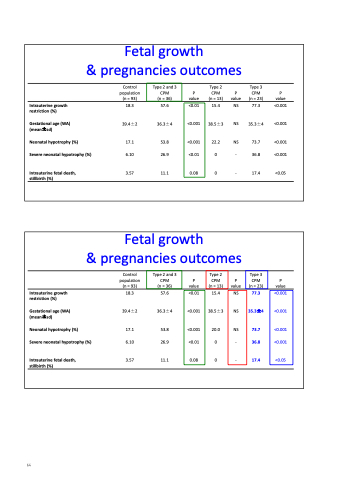
 Fetal growth
& pregnancies outcomes
   Control population (n = 93)
18.3 57.6
39.4±2 36.3±4 17.1 53.8
6.10 26.9 3.57 11.1
P value
Type 2
CPM P
(n = 13) value 15.4 NS
38.5±3 NS 22.2 NS
0 - 0 -
Type 3 CPM (n = 23)
77.3
35.3±4 73.7
36.8 17.4
P value
<0.001
<0.001
<0.001 <0.001
<0.05
Type 2 and 3 CPM
(n = 36)
 Intrauterine growth restriction (%)
Gestational age (WA) (mean±sd)
Neonatal hypotrophy (%) Severe neonatal hypotrophy (%)
Intrauterine fetal death, stillbirth (%)
<0.01
<0.001
<0.001 <0.01
0.08
    Intrauterine growth restriction (%)
Gestational age (WA) (mean±sd)
Neonatal hypotrophy (%) Severe neonatal hypotrophy (%)
Intrauterine fetal death, stillbirth (%)
15.4 77.3
38.5±3 35.3±4
20.0 73.7 0 36.8
0 17.4
Fetal growth
& pregnancies outcomes
Control
population P
    Type 2 and 3 CPM
(n = 36)
P value
<0.01
<0.001
<0.001 <0.01
0.08
Type 2 CPM (n = 13)
P value
NS
NS
NS -
-
Type 3 CPM (n = 23)
<0.001
<0.001
<0.001 <0.001
<0.05
    (n = 93)
18.3 57.6
39.4±2 36.3±4 17.1 53.8
6.10 26.9 3.57 11.1
value
      61
 64
